How to become a data scientist, part 3: tell people about your work
Posted on Thu 14 April 2022 in data science
In part 1, I suggested you find a good problem. In part 2, I suggested you try to solve it. Here I discuss how to tell people what you did.
Let me start with a story. I was presenting some work, a couple weeks of digging in data to define a segmentation of search queries that people could use to think about search. I looked out at the audience, saw most people waiting, checking their email. I said, “Let’s get started” and several laptop lids closed. I said, “I’d prefer it if you closed your laptops.” The rest closed, but a couple of people were still staring at their phones. I called one out, saying, “Hey A, something interesting?”, pressing to get those phones down. After a short tussle, mostly everyone was paying attention, and I started.
Why did I work so hard? Why offend people? Because I’m old? Sure, I remember life before smartphones. I like to get my cane out and shake it at the young ‘uns until they get off my lawn. But also because it doesn’t matter what I say, only what they hear. The purpose of data science is its effect on others. Readers, listeners, decision-makers, users.
Below, I describe two situations: you 1) did an analysis, or 2) built a product (or feature or tool). Maybe you did both.
The analysis goal: tell a story, with evidence

There is some debate over whether you should engage in “story-telling.” Some consider it over-hyped. It’s not. People remember and repeat stories.
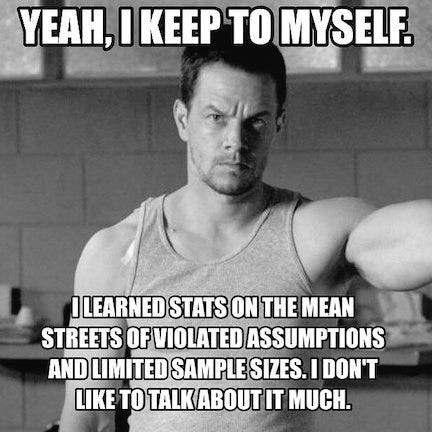
They also remember and repeat memes and pop songs. You can use those to get your point across, but it’s harder and often doesn’t fit exactly. We’ve all seen people trying to get a point across like Research Wahlberg:

It’s fun, but people often remember the joke, not the point.
By contrast, stories can and should be tailored very specifically to your point, like the cranky old man story I opened with.
Ideally, you answered some part of the high-level (“research”) question you asked when you chose the problem. Now:
- Describe the question and the answers. I’ve seen plenty of writeups without a clear question (why did they do this?), or without a clear answer (what happened, precisely?).
- Highlight a few takeaways. People are only going to remember a few things, say three or fewer. Spoon feed them!
- Make recommendations. Sometimes I have observations without recommendations, because I want to get something out. Readers hate this. They want persuasive writing. That means you have a position, and you’re trying to convince someone of it, ideally with evidence. Honestly, it’s also easy to convince without evidence, but to live with myself, I prefer evidence. If you chose an actionable question, these recommendations should come easily.
- Be brief, but don’t tease. Analyses often have an executive summary. Research papers usually have an abstract. No one has time to read everything. Your summary should be self-contained, with the main results, and some numbers. Ideally, it is intriguing enough that people want to read more. Don’t tease. Some abstracts state the question and methods precisely, but leaves the answer for the full writeup. Those authors suck. Gimme the answer. If it’s interesting, I’ll want to know more anyway.
- Be clear and compelling. Write well. Present well. There are many books on this. I should do another post with English writing recommendations, and another on making a presentation. If it’s a live presentation, watch and respond to your audience. Keep them with you.
- Show multiple lines of evidence. If you have numbers, that’s good. If you have user feedback, that’s also good. If you’ve looked at edge cases or important use cases, that’s also good. More different sources can make a case much stronger. Numbers can lie, as can user stories. It’s harder to make everything lie.
- Finally: don’t just do what people asked, do what’s right. People often don’t know what they want, or want the wrong thing. Part of your value is figuring that out. (“Wrong” might be “unhelpful” or “unethical” or “nonsensical”, it varies.) This is even more true as you get more senior. People expect you to figure things out (“handle ambiguity”). That’s what they pay for.
You don’t have to fully solve your problem or answer your question. You just need a good question and some progress: more insight than before you started. You may have only worked a couple of weeks, especially if you want to check in to see if you’re headed in the right direction.
Most people prefer fast to complete. See part 1, wherein Jeff Bezos said, “Most decisions should probably be made with somewhere around 70% of the information you wish you had.” Academics jokingly aim at an LPU, a “least publishable unit”. A ten-page academic paper can be months of work instead of weeks, but the point is everyone breaks up their work.
The product goal: tell a story, with evidence

Yep, same goal.
Say you built a recommender. Is it any good? With no proof, a reputable business isn’t going to drop a tool on its users, nor will an academic conference publish a result.
So the story is often, “Here is why I built the product (or feature or tool), and evidence that it works.” For a product at a large Internet business, this may be an A/B experiment showing user experiences in aggregate. For an internal tool, you can do a user study (like this).
There is a burgeoning field of explaining machine learning models, that I've written about. The short version is: people should not believe results from a “black-box” model (one whose assumptions you cannot examine). You should know more about why a model is producing its predictions, to prevent machines from picking up and amplifying the wrong thing.
There is a related mistake I’ve seen professionally: when people define a goal metric (an objective, numeric way of measuring success), and then treat any positive movement in a number as success. No metric encompasses everything you want. If your goal metric is user engagement, you may get clickbait. Closely related is Goodhart’s law: “Any observed statistical regularity will tend to collapse once pressure is placed upon it for control purposes,” often restated, “When a measure becomes a target, it ceases to be a good measure.”
You should always look at both quantitative measures (towards the goal) and qualitative measures (examples, edge cases), to keep yourself honest. That would force you to stare at the clickbait and say, “Is this really what I want?”
If you often find that your numbers look good, but looking at individual cases doesn’t, consider coming up with “guardrail metrics”, other measures to keep you honest. Your new quantitative goal would be “maximize our primary goal metric while not making the guardrail metrics any worse.”
An example of numbers looking good is “users click more on content.” An example of a related guardrail is “user reports of bad content remain low,” or “human labeling of a sample of content stays at low levels of bad content.”
Conclusion: persuade others
The purpose of data science is its effect on others.
Persuade. Make recommendations. Be clear and compelling. Tell a story, with evidence.
Do what’s right. Don’t just look at numbers.
All of these help you communicate with readers, listeners, decision-makers, users.
One step
One full step of the data science journey:
- Pick a good problem
- Try to solve it
- Communicate
If you’re lucky, affect others, repeat.
Yes, luck plays a part. My efforts over the years have had widely varying levels of success, and it’s hard to tell what will happen beforehand. Just keep taking shots, and some will land.
This concludes my three-part series on how to become a data scientist. I hope you enjoyed it. Let me know.
Previous: How to become a data scientist, part 2: try to solve the problem.
This is part of a series. Part 0 is here.